Structural Analysis

Qualitative decomposition of key inflection points. Contribution estimates based on order-of-magnitude reasoning; precise decomposition would require fund-level portfolio data.

Banks Instituições Financeiras

Why did bank holdings increase in 2019?

Basel III LCR reached 100% (Jan 2019)

CMN Resolution 4.401/2015 phased in the Liquidity Coverage Ratio in annual steps, reaching 100% in January 2019. Banks must hold High Quality Liquid Assets equal to 100% of projected 30-day stressed outflows — and HQLA in Brazil is almost entirely federal securities (LFTs, LTNs, NTN-Bs).

Pension reform spread compression

Bolsonaro's pension reform (approved October 2019) materially reduced long-term fiscal risk. Banks had been light on government bonds following the Dilma crisis of 2014-2016.

Subdued credit demand

Private sector credit growth remained sluggish starting in 2019 as corporates found more attractive funding opportunities in the debentures market due to retail tax incentives.

Brazilian banking sector
Metric 2005 2010 2015 2020 2025*
Credit / GDP 28.0% 45.1% 53.7% 61.8% 57.5%
Bank Assets / GDP 74.2% 98.5% 118.4% 131.7% 128.0%
Corporate Loans (PJ) / GDP 14.5% 23.0% 25.7% 29.6% 21.0%
Individual Loans (PF) / GDP 13.5% 22.1% 28.0% 32.2% 36.5%
Earmarked / Total Credit 31.1% 36.4% 49.2% 51.0% 39.5%

Source: BCB Relatório de Economia Bancária & Notas de Crédito (December of each year). *2025 preliminary. Universe definition means these numbers may disagree slightly with numbers elsewhere.

Funds Fundos de Investimento

Why did fund holdings top out around 2019?

Fixed income fund outflows (Selic collapse)

The easing cycle (2.0% in 2020) collapsed returns on DI/renda fixa funds, which predominantly hold LFTs. The entire fixed income fund industry had been built around double digit Selic.

Rotation to equities and FIIs

2019 was a record year for the Ibovespa and a boom year for Fundos de Investimento Imobiliário (FIIs). Capital that previously sat in DI funds recycled into equity funds, FIIs, and multi-market funds chasing higher returns.

CRI/CRA and debenture substitution

Within fixed income mandates that remained, managers shifted from government bonds to higher-yielding tax-exempt instruments: CRIs (real estate receivables), CRAs (agribusiness receivables), and debentures incentivadas. These offer better after-tax yields than LTNs/NTN-Bs for the same duration risk, and the market grew rapidly from 2017 onward.

Tesouro Direto disintermediation

As Selic fell, paying 0.5–1.0% annual management fees on a DI fund earning 4–6% became hard to justify. Retail investors shifted to buying LFTs and NTN-Bs directly via Tesouro Direto (TD), bypassing funds entirely. Registered TD investors grew from ~1.5M to 3M+ between 2018 and 2020.

Pensions Previdência

Why did pension holdings surge after 2016?

Selic and NTN-B yields beat actuarial targets

Pension funds must earn INPC/IPCA + ~5–6%/year to meet actuarial benchmarks. With NTN-B real yields well above those targets, there was no reason to take credit or equity risk.

PREVIC de-risking mandates

Many large funds posted massive deficits as equity portfolios collapsed. PREVIC required deficit funds to file formal recovery plans (planos de equacionamento) mandating minimum government bond allocation floors. This converted a voluntary gradual reallocation into a mandatory accelerated one.

FUNPRESP structural growth

The complementary pension fund for federal civil servants (created 2013) reached meaningful AUM scale by 2015–2016. By design it invests predominantly in federal securities, adding a steady policy-driven bid for DPF that did not exist before 2013.

Pension segment breakdown (2026)
Feature EFPC
Legacy Closed
EAPC
Open / Retail
Funpresp
New DC Closed
AUM Share ~11% of GDP
Shrinking
~12% of GDP
Stagnant
~2% of GDP
Surging
Target Audience Employees of old SOEs (Previ, Petros) or big private corps. General public (retail banking customers) New federal civil servants
Regulator PREVIC SUSEP PREVIC
2026 Trend Decumulating: payouts to "old guard" retirees exceed new inflows. Opportunistic: banks fighting for portability; high Selic hitting inflows. Explosive accumulation: mandatory for all new hires; 1-for-1 gov match.
Foreigners Não-residentes

Why did foreign holdings top out in 2016?

BRL depreciation destroyed FX returns

The BRL collapsed from ~R$2.20/USD in 2013 to ~R$4.00 by early 2016.

Sovereign downgrade and political risk

S&P downgraded Brazil to junk in September 2015; Moody's followed in February 2016. Many institutional mandates have hard floors prohibiting sub-investment-grade holdings, triggering forced selling.

Holdings Growth (CAGR by Holder Type)

Feb 2026 vs. anchor date. ~19yr uses Jan 2007 (earliest available).

Holder Now (R$ bn) 1yr 5yr 10yr ~19yr
Banks 2,703 26.2% 12.6% 15.6% 10.2%
Funds 1,837 14.9% 8.1% 12.7% 9.1%
Pensions 1,922 11.2% 11.4% 12.2% 13.1%
Foreigners 915 32.0% 14.4% 6.8% 23.2%
Other 1,134 11.6% 12.8% 10.8% 10.8%
Total DPFi 8,511 18.6% 11.4% 12.3% 11.3%
Avg cost of debt (period avg, Dec of each yr) 11.9% 10.7% 10.3% 11.3% 11.3%

Bond Type & Maturity Composition — DPMFi Feb/2026

Source: Tesouro Nacional — Relatório Mensal da Dívida Pública Federal, Fevereiro 2026.

Why Each Investor Class Holds What It Holds

Portfolio structure reflects the interplay between liability profiles, regulatory requirements, liquidity needs, and return mandates. The two charts above are a snapshot; the explanations below describe the structural logic that generates them.

Bond Type Preference

Banks Inst. Financeiras

Why 60% floating (LFT)?

Basel III LCR / zero mark-to-market risk Core driver

LFTs (Tesouro Selic) reset daily to the Selic overnight rate. Their price never deviates from par, meaning they carry zero interest-rate duration risk. For banks funding short-term deposit liabilities, this is the perfect HQLA asset: they satisfy the Liquidity Coverage Ratio (LCR) and introduce no mismatch between asset sensitivity and liability sensitivity.

ALM discipline Supporting

Banks raise funds through CDBs, LCIs, LCAs and demand deposits — all floating-rate or short-term.

Some NTN-B for inflation-linked CDB hedging Minor

Banks that issue IPCA+ CDBs or IPCA-linked LCIs hold NTN-Bs as a natural liability hedge.

Investment Funds Fundos

Why 75% floating (LFT)?

Daily liquidity / DI fund mandate Core driver

Brazil's dominant retail fixed-income product is the Fundo DI — a money-market-style fund that tracks the CDI overnight rate with T+0 or T+1 liquidity. To honor same-day redemptions, portfolio managers must hold near-zero-duration assets.

NAV stability requirement Supporting

A fund holding significant duration would show negative daily returns when rates rise — unacceptable for clients who expect the DI fund to behave like a savings account. Any credit or duration risk is routed to multimarket funds, not DI funds.

Competition from CRIs, CRAs, debentures Structural shift

When Selic fell post-2019, DI funds lost assets to tax-exempt credit instruments (CRI, CRA) offering better after-tax yields. The remaining DI fund AUM is the most conservative slice — heavy in LFTs. Higher-yielding mandates rotated out entirely.

Margin collateral for leveraged derivatives Multi-market funds

Multimercado (multi-asset) funds run leveraged positions on B3 futures. B3's clearinghouse accepts LFTs as margin collateral at full face value with no haircut, because their price never deviates from par. Holding LFTs as collateral is more capital-efficient than cash: the fund earns the full Selic on the collateral while simultaneously using it to support its futures book.

Pensions Previdência

Why 54% IPCA-linked (NTN-B)?

Actuarial liability matching (ALM) Core driver

Brazilian pension funds (EFPCs) must earn INPC/IPCA + 5–6% per year to meet their actuarial benchmark. NTN-Bs (Tesouro IPCA+) deliver exactly this: a real yield above IPCA, locked in at purchase. Long-dated NTN-Bs (2035, 2045, 2055, 2060) allow duration matching against liabilities that extend 20–40 years into the future.

Regulatory floor (PREVIC/CNPC) Supporting

CMN Resolution 4,994/2022 (replacing 3,792) requires defined-benefit plans to maintain actuarially sound portfolios. Funds with deficits must file recovery plans mandating higher government bond allocations. Many large funds (Previ, Petros, Funcef) were compelled to increase NTN-B weights after equity losses in 2015–2016.

Why also 40% LFT? Liquidity buffer

Pension funds pay monthly benefits to retirees. LFTs are held as a liquid reserve to fund near-term outflows without selling long NTN-Bs at a loss. The target is to hold 2–3 years of projected benefits in short, liquid instruments.

Foreigners Não-residentes

Why 72% prefixed (LTN/NTN-F)?

Directional rate bets / carry trade Core driver

Foreign investors primarily enter Brazil to exploit interest rate differentials and anticipate easing cycles. Prefixed bonds (LTNs and NTN-Fs) offer the largest mark-to-market gain from Selic cuts.

Avoiding inflation basis risk Supporting

Duration and currency risk already hard enough to predict for foreign investors, no need to overcomplicate. IPCA-linked bonds are also less liquid in secondary markets for foreign participants.

Mandate constraints Structural

Some global EM mandates also cap duration, pushing foreign allocations toward 2–5yr LTNs rather than 30yr NTN-Bs.

Maturity Preference

Banks Inst. Financeiras

Moderate duration (1–5 yr core)

LCR-driven duration insensitivity for LFTs Key insight

LFTs technically carry multi-year legal maturities (e.g. LFT 2029, LFT 2031) but behave as overnight instruments — they reset daily to Selic and never deviate from par. This means the maturity distribution for banks overstates their true duration risk: the bulk of the 1–5yr bucket is LFTs with no effective duration.

Trading book and repo collateral Supporting

Banks actively trade DPF across all maturities in their trading books and hold them as repo collateral with the BCB (overnight facility). The 3–5yr and 5yr+ segments reflect LTNs and NTN-Bs held as repo collateral or fair-value hedges for structured products.

Investment Funds Fundos

Short-end concentrated (<3 yr)

Liquidity mandate forces short duration Core driver

68% of fund holdings mature in less than 3 years. CVM rules also require daily mark-to-market.

Only 10.8% in 5yr+ — the long-end is for pensions Contrast

Long NTN-Bs (2045, 2055, 2060) are held almost exclusively by pensions and insurance companies. Funds that do hold long duration are typically classified as "FI Renda Fixa Longo Prazo" with lock-up periods — they serve a different client profile and represent a small portion of total fund DPF exposure.

Pensions Previdência

Longest duration (40% in 5yr+)

Duration matching — 20–40 year liabilities Core driver

A pension fund paying benefits to a 50-year-old participant has a liability stream extending 30+ years. Long NTN-Bs (2055, 2060) lock in a real yield for decades.

Immunization strategy Technical

Sophisticated EFPCs use duration immunization (matching asset and liability Macaulay durations) and cash flow matching (buying bonds whose coupons/principal coincide with projected benefit payments). This is only possible with a range of maturities — hence the spread across 1–3yr (LFTs for near-term benefits), 3–5yr (medium NTN-Bs), and 5yr+ (ultra-long NTN-Bs for retirement horizon liabilities).

Foreigners Não-residentes

Overwhelmingly front-end (52% under 1 yr)

Duration risk minimization Core driver

With double digit yields some investors woudld rather not worry about additional duration risk.

Liquidity and bid-ask spreads Supporting

The short end of the Brazilian yield curve (LTN maturities up to 2yr) is the most liquid DPF segment, with the tightest bid-ask spreads and deepest secondary market. They can sometimes be more cost efficient than NDFs. Long NTN-Bs (2050+) trade in much smaller size and with wider spreads.

Basis Common structure

Many EM hedge fund pods run a "Cupom Cambial" strategy: buy short LTNs, roll at maturity, capture the positive carry vs. USD funding costs while hedging FX via NDF or onshore FX swaps.

Debt Stock, Supply Drivers & Issuance Dynamics
Source: Tesouro Nacional DPMFi — February 2026 | BCB FOCUS Survey
R$ 8.8 tri
Total DPF Stock (Feb/26)
49%
Floating-rate share (LFT) — up from ~25% a decade ago
~3.8 yr
DPMFi weighted average maturity
+R$ 199.6 bi
MoM DPF change (Feb/26)
+R$ 1,349 bi
YoY DPF change (Feb/26 vs Feb/25) · +18.0%
Estoque da DPF — Fevereiro 2026 (R$ bi)
Instrument Dez/25 Jan/26 Fev/26 Share MoM Δ
DPF (Total) 8,635.1 8,641.1 8,840.7 100% +199.6
Taxa Flutuante (LFT) 4,166.7 4,270.4 4,340.9 49% +70.5
Índice de Preços (NTN-B) 2,239.5 2,277.0 2,285.5 26% +8.6
Prefixados (LTN / NTN-F) 1,904.0 1,784.3 1,885.9 21% +101.6
Câmbio (DPFe) 324.9 309.5 328.4 4% +18.9
DPMFi (Local) 8,309.0 8,330.5 8,511.3 96% +180.8
What Drives Monthly Debt Growth?
① Primary Deficit Net fiscal borrowing requirement
Brazil has run primary deficits since 2014

The primary balance (revenues minus non-interest spending) has been negative for most of the past decade. Forecasting the deficit was perenially hard (see FOCUS consensus) due to macro volatility, mid-year politically driven spending announcements, and other factors, but despite its flaws the 2023 fiscal framework has reduced forecast error.

② Interest Accrual The dominant driver at current Selic levels
~¾ of net debt issuance is interest, not new spending

With Selic at ~14.75% and total DPF near R$8.8 trillion, monthly interest accrual runs ~R$108bn. Because 49% of the stock is LFT (Selic-linked), rate cuts directly reduce this snowball effect, while rate hikes accelerate it. The Feb/26 MoM debt increase of R$199.6bn splits roughly 50/50 between accrued interest and net new issuance.

③ Seasonal Maturities Redemption calendar drives issuance timing
Maturity spikes are instrument-driven

The redemption calendar concentrates around specific instrument maturities. Despite these lumpy maturities, 2025 gross issuance was remarkably stable: H1 averaged R$163bn/month versus R$140bn in H2 — only a ~16% gap. The Treasury smooths issuance through pre-financing and its cash reserve buffer, absorbing maturity spikes without forcing large auction concessions.

Each line shows how market consensus for a given calendar year's primary balance (% GDP) evolved over time. Negative = deficit. Source: BCB FOCUS survey, weekly median.

PAF 2026 — Annual Financing Plan Targets

The Plano Anual de Financiamento (PAF) is published by the Treasury each January, setting indicative composition and maturity targets for the year. Targets are not legally binding — they are guides for issuance strategy, with stated intentions to:

  • Increase fixed-rate share (Prefixados) at the margin, reducing Selic sensitivity
  • Maintain stable inflation-linked exposure to satisfy pension fund demand
  • Gradually extend weighted average maturity (WAM) beyond 3.8 years
  • Keep floating share elevated near-term due to investor demand for LFT at current yield levels
Market constraint: With Selic above 13%, investors strongly prefer LFT (Tesouro Selic). Attempts to shift issuance toward fixed-rate bonds face a steep concession — the Treasury must offer a materially higher yield than Selic to attract buyers away from the daily-reset LFT. This limits how quickly the floating share can be reduced.
2026 Maturity Schedule by Instrument (R$ bn)
2026 DPMFi maturity schedule by instrument

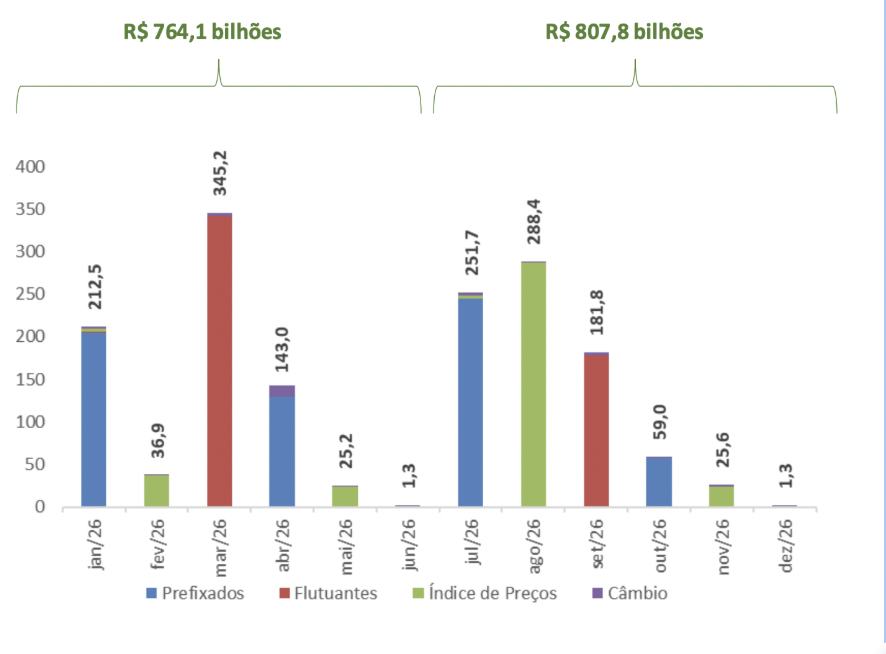
H1/26 = R$764.1bn (Mar spike driven by LFT rollover); H2/26 = R$807.8bn (Aug spike driven by NTN-B). Source: DPMFi Feb/26 report.

Maturity Walls & Treasury Strategy by Instrument
Instrument Heaviest Maturity Months Common Maturities Issued Treasury Rollover Strategy
LFT
Floating / Selic
Mar 2027 (~R$490bn)
Sep 2027
Mar 2032 (primary benchmark) Aggressively rolling legacy 3-yr debt into a single 6-yr benchmark to reduce single-month cliff risk
LTN
Zero-coupon fixed
Jul 2026 (R$251.7bn)
Apr 2027
Apr 2027 (12m)
Jan 2032 (72m)
Establishing 6 tenors (6m–72m) to distribute redemptions and avoid single-month spikes
NTN-F
Fixed 10% semi-annual coupon
Jan 2027 (~R$310bn+ principal + coupons) Jan 2031 (5-yr)
Jan 2037 (10-yr)
Shifting the "January wall" from 2027 into 2031/2037 benchmarks to extend duration
NTN-B
IPCA + real yield
Aug 2026 (R$288.4bn)
May 2027
May 2031
Aug 2040 (standard tenors)
Offering IPCA + 6% to prevent EFPCs (pension funds) from selling into the secondary market
Emissões mensais 2025 — LFT / LTN / NTN-B / NTN-F

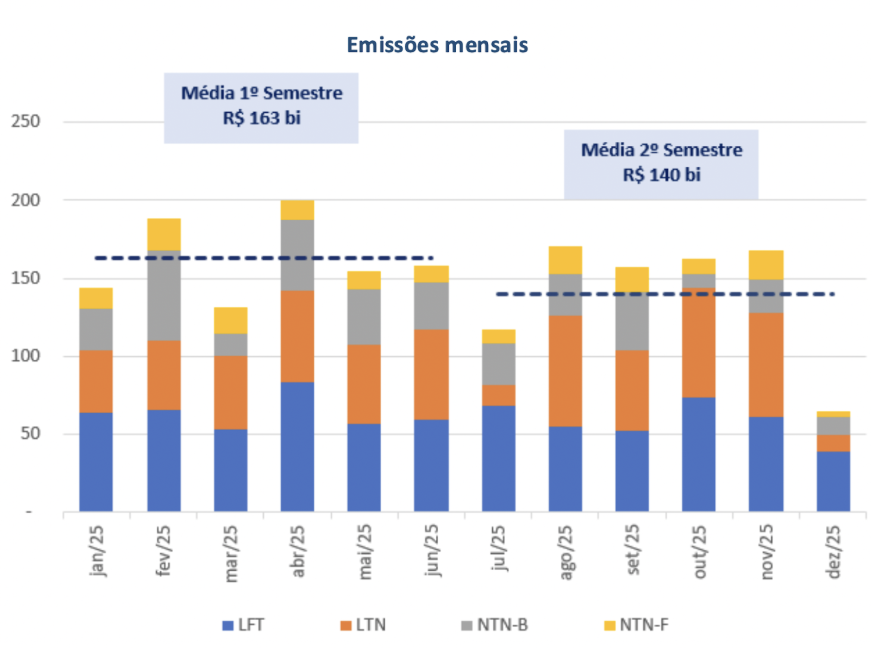
Source: DPMFi Feb/26 report. H1 avg R$163bn/month, H2 avg R$140bn/month — Jan/25 through Dec/25.

Source: STN/Tesouro Nacional RMD Fev/26 (Anexo 1.6). Dívida Mobiliária (global bonds) only; R$ billions. 2015 and 2022 = zero issuance. Note: BRL depreciation inflates later years in BRL terms.

Treasury Cash Reserve

The Treasury maintains a cash buffer equivalent to 6–9 months of upcoming maturities, held in the Conta Única at the BCB. This reserve is used opportunistically — the Treasury can step back from primary auctions when market conditions are unfavorable (high risk premia, stressed liquidity) and draw down the buffer instead. In practice this means issuance over-shoots financing needs in benign conditions and under-shoots during stress. The buffer also provides fiscal credibility: it insulates near-term debt servicing from short-term market disruptions.

Annual Demand by Investor Type
Annual sum of monthly changes in holdings · R$ Billions · 2016–2025 · Source: Tesouro Nacional RMD Anexo 2.7
Annual Net Issuance by Bond Type
Annual sum of gross sales minus maturities · R$ Billions · 2016–2025 · Source: Tesouro Nacional RMD Anexo 1.3
Gross Issuance vs. Maturities by Bond Type
Gross sales (positive) and maturities (negative, hatched) · R$ Billions · 2016–2025 · Source: Tesouro Nacional RMD Anexo 1.3 · Demais excluded (no gross issuance data)
Auction Congestion

Dealers must absorb large gross supply even when it is merely replacing maturing paper. Balance sheet capacity is finite, so heavy auction calendars widen concessions regardless of what the net figure shows.

Duration Extension on Rollover

Treasury rarely rolls a maturity into the same instrument. A maturing NTN-B is typically replaced with a longer-dated one — so even net-zero issuance can represent significant duration extension being pushed onto the market.

Maturity Wall & Liquidity Risk

Large maturity clusters concentrate reinvestment risk. If sentiment sours when a R$300bn+ maturity wall hits, the rollover can price very badly — or partially fail — even if the annual net number looks benign.

Foreign Investor Optics

Global macro funds size Brazil risk against the gross auction calendar. A country rolling R$300bn+ in NTN-Bs in a single year reads as vulnerable to a confidence shock — net issuance notwithstanding. The 2024 episode is the clearest recent example.

Demand: Monthly Change in Holdings
Net change in outstanding holdings by investor type · R$ Billions · Jan/2023 – Feb/2026 · Source: Tesouro Nacional RMD Anexo 2.7
Investor Type12M Avg (R$bn)36M Avg (R$bn)
Banks (Inst. Financeiras)+46.8+31.7
Funds (Fundos)+19.9+12.4
Pensions (Previdência)+16.2+17.8
Foreigners (Não-res.)+18.5+10.2
Other+9.8+8.3
Supply: Net Issuance by Bond Type
Gross market sales minus maturities (Vendas − Vencimentos) · R$ Billions · Jan/2023 – Feb/2026 · Source: Tesouro Nacional RMD Anexo 1.3
Bond Type12M Avg (R$bn)36M Avg (R$bn)
LFT (Floating)+17.8+21.3
LTN (Short Fixed)+1.4-3.0
NTN-B (IPCA-linked)+0.5-3.8
NTN-F (Long Fixed)+11.4+3.1
Demais-2.7-3.3

Note — Supply and Demand will not reconcile. The demand series (Anexo 2.7) measures the month-over-month change in outstanding stock, which includes IPCA principal correction on NTN-Bs accruing every month without any cash transaction. The supply series (Anexo 1.3) measures only cash transactions — gross sales minus maturities — and excludes bond exchanges (Trocas), where Treasury swaps old bonds for new ones with no net money raised. Expect demand to run structurally above supply.

Flow Proxies

Observable, near-real-time indicators that proxy for each investor class's demand before the monthly RMD is published (~3–4 week lag).

Banks Instituições Financeiras

Structural LCR demand meets cyclical credit dynamics.

Basel III LCR ratio Core driver

BCB requires banks to hold HQLA equal to 100% of projected 30-day stressed outflows. Brazilian HQLA is almost exclusively federal securities (LFTs, LTNs, NTN-Bs). Monthly LCR disclosures signal whether banks are at the floor and forced to buy, or holding excess buffer.

Credit growth vs. deposit growth (BCB Nota de Crédito) Supporting

When loan growth lags deposit funding growth, the surplus lands in government bonds. Monitor the spread between total deposits and total credit outstanding; a widening gap is a leading indicator of bank DPF demand.

CDB / LCI / LCA net issuance (ANBIMA monthly) Supporting

Banks that grow their liability book faster than their loan book must deploy the excess. Net issuance of CDBs and tax-exempt LCIs/LCAs above credit origination growth tends to flow into LFTs.

COPOM rate decisions Directional

Rate hikes increase LFT daily carry, making them more attractive vs. credit risk on a risk-adjusted basis. Rate cuts do the opposite and can shift banks toward longer-duration NTN-Fs for yield pickup.

Investment Funds Fundos de Investimento

Fund flows are the most timely proxy — ANBIMA publishes weekly.

ANBIMA fund flow data (weekly) Core driver

Net subscriptions/redemptions by fund category (DI, renda fixa, multimercado) are the most direct proxy. DI fund inflows translate almost mechanically into LFT demand; renda fixa inflows into LTN/NTN-B demand.

CRI / CRA new issuance (CVM/ANBIMA) Structural shift

Tax-exempt credit instruments compete directly with government bonds for fixed income fund allocations. Heavy CRI/CRA issuance months reliably correlate with government bond underperformance in fund portfolios.

Tesouro Direto net flows Supporting

Retail Tesouro Direto net purchases signal broad fixed income sentiment. TD growth reduces the intermediary role of fixed income funds, structurally compressing DI fund AUM over time.

Multimercado leverage (ANBIMA risk reports) Tactical

When multimercado funds are running high gross leverage in DI futures, they also tend to hold more government bond collateral. Futures positioning data (B3) gives a weekly read. Returns-based analysis of “O Kit Brasil” can proxy positioning.

Pensions Previdência

Demand is largely automatic once real yields exceed actuarial targets.

PREVIC funded ratio reports Core driver

Funded ratio below 100% forces pension funds to extend duration and increase NTN-B allocations to close the gap between assets and actuarial liability. Published quarterly but widely tracked in real time by plan sponsors.

NTN-B real yield vs. actuarial target Core driver

The actuarial benchmark for most Brazilian defined-benefit plans is INPC/IPCA + 5.5–6.0%/year. When NTN-B real yields trade above this level, buying is nearly automatic. When below, demand stalls.

Benefit payment schedule / net cash flow Supporting

Pension funds with negative net cash flow (outflows > contributions) are forced sellers of LFTs to fund monthly benefits. Periods of demographic stress compress LFT holdings and increase NTN-B duration bias.

FUNPRESP contribution flows Structural

The federal civil servant pension fund grows at a fixed rate tied to enrollment and contribution rules. Its DPF demand is policy-driven and largely insensitive to market signals — a baseline bid that can be modeled from payroll data.

Foreigners Não-residentes

High-frequency BCB and B3 data lead the RMD by 3–4 weeks.

BCB capital flow report (weekly) Core driver

BCB publishes weekly portfolio investment flows in fixed income ~10 days after the reference week — roughly 3 weeks ahead of the RMD. The closest real-time proxy available.

B3 foreign custody data Core driver

B3 publishes daily foreign holdings of DPMFi bonds in custody. Provides near-daily resolution on foreign demand direction even before BCB or RMD data.

Cupom Cambial Supporting

At times, foreign hedge funds can buy LTNs and hedge out FX via the cupom cambial market, capturing a pickup over USD-equivalent debt that is quite attractive on a hedged basis.

Price Signals

Market prices that influence or predict each investor class's allocation decisions.

Banks Instituições Financeiras

SELIC level and curve shape determine LFT vs. LTN duration preference.

SELIC / DI rate level Primary

LFTs reprice daily at SELIC. A high absolute SELIC rate makes LFTs attractive vs. private credit — banks earn near-sovereign returns with zero duration risk. The higher the SELIC, the more LFT-heavy bank portfolios tend to be.

Short end of the yield curve (DI futures, 1–3Y) Primary

When the front end of the DI curve is inverted or flat, banks favor LFTs over LTNs for LCR purposes (LFTs carry no mark-to-market volatility). A steep curve can encourage extension into LTNs for yield pickup.

CDB spread over DI Supporting

When bank funding costs (CDB rates) rise above DI, NIM compression incentivizes more sovereign bond holding as a low-risk, liquid asset. Narrow CDB spreads allow banks to be more selective.

BCB COPOM forward guidance Directional

Clear rate guidance anchors duration decisions. A hiking cycle → LFT overweight; a credible easing cycle → incremental shift to LTN/NTN-F.

Investment Funds Fundos de Investimento

Real rate level drives inflows; curve shape and credit spreads drive duration.

DI rate vs. IPCA (ex-ante real rate) Primary

High real rates attract inflows to fixed income funds broadly. When the DI-implied real rate exceeds ~7–8%, retail allocation to fixed income funds surges and government bond demand follows.

LTN / NTN-F term premium Supporting

The slope between 1Y and 5Y LTN yields determines whether funds extend duration. A steep curve (>150bps) encourages extension into NTN-Fs; a flat or inverted curve pushes funds to LFTs or shorter LTNs.

CRI/CRA spread vs. LTN (same duration) Structural

The key substitution signal for fixed income fund managers. When tax-exempt credit spreads compress toward government bond yields (net of tax advantage), funds rotate back into government bonds. Currently tracking ~80–120bps net spread.

Ibovespa / equity risk premium Tactical

When equities are cheap relative to bonds (earnings yield well above NTN-B real yield), multimercado funds rotate from fixed income to equities, reducing DPF demand. The equity/bond frontier matters for multi-asset allocations.

Pensions Previdência

Long-end NTN-B real yields are the primary trigger for duration extension.

NTN-B real yield curve (2035, 2045, 2050) Primary

The single most important price signal for pension demand. Long-end NTN-B real yields above IPCA + 6.5% have historically triggered aggressive buying by defined-benefit plans. Currently ~7.0–7.5% on the long end — elevated by historical standards.

NTN-B curve shape (short vs. long end) Primary

When long-end NTN-Bs yield 50–100bps more than 5Y NTN-Bs, pension funds extend duration to match long-dated liabilities. When the curve is flat or inverted, they park in shorter NTN-Bs and LFTs.

IPCA expectations — FOCUS survey (2Y ahead) Supporting

Higher inflation expectations erode the attractiveness of nominal bonds (LTN/NTN-F) for pensions with IPCA-linked liabilities. Elevated FOCUS inflation = tilt toward NTN-B over NTN-F.

Actuarial discount rate regulatory floor (CNPC) Structural

CNPC Resolution 30 sets maximum discount rates for actuarial liability valuation at INPC + 4.16%–6.05% depending on plan vintage. When market NTN-B yields approach or breach the cap, pensions are technically in surplus — reducing urgency to buy.

Foreigners Não-residentes

Currency trend and carry-to-vol are the two dominant signals for foreign investors.

USD/BRL trend — CTA momentum signal Primary
Carry to vol Primary
CDS 5Y Brasil Supporting
DXY / VIX Directional

Bonds Outstanding

ANBIMA MaRC daily pricing (2026-03-26) · Tesouro Nacional RMD Anexo 2.2 · Notional as of Fev/26 · Duration computed from coupon schedule: LTN (zero-coupon), NTN-F (10% p.a. semi-annual), NTN-B (6% p.a. semi-annual), LFT (floating-rate, duration ≈ 0) · LFT yields = Selic (14.75%) + spread; LTN/NTN-F are nominal; NTN-B are real (IPCA+)

Bond Type ISIN Maturity Date Notional (R$bn) Yield (%) Duration (yrs)
LFT BRSTNCLF1RE0 2026-03-01 341.39
LTN BRSTNCLTN8B5 2026-04-01 127.95 14.7172 0.01
LTN BRSTNCLTN848 2026-07-01 208.09 14.1887 0.23
NTN-B BRSTNCNTB4U6 2026-08-15 235.62 8.7396 0.37
LFT BRSTNCLF1RF7 2026-09-01 166.76 -0.0510 0.00
LTN BRSTNCLTN8G4 2026-10-01 65.43 14.0807 0.45
LTN BRSTNCLTN8C3 2027-01-01 5.72
NTN-F BRSTNCNTF1P8 2027-01-01 111.62 14.1725 0.70
LFT BRSTNCLF1RG5 2027-03-01 539.16 0.0006 0.00
LTN BRSTNCLTN8I0 2027-04-01 91.84 14.1443 0.89
NTN-B BRSTNCNTB682 2027-05-15 126.22 8.1808 1.05
LTN BRSTNCLTN871 2027-07-01 99.51 14.1277 1.11
LFT BRSTNCLF1RH3 2027-09-01 463.18 0.0085 0.00
LTN BRSTNCLTN8L4 2027-10-01 101.56 14.1623 1.33
LTN BRSTNCLTN897 2028-01-01 61.10 14.0946 1.55
LFT BRSTNCLF1RI1 2028-03-01 321.92 0.0143 0.00
LTN BRSTNCLTN8M2 2028-04-01 9.27 14.0652 1.77
LTN BRSTNCLTN8F6 2028-07-01 21.83 14.0751 1.99
NTN-B BRSTNCNTB4X0 2028-08-15 230.31 8.1141 2.16
LFT BRSTNCLF1RK7 2028-09-01 323.21 0.0250 0.00
LTN BRSTNCLTN806 2029-01-01 173.38 14.1260 2.43
NTN-F BRSTNCNTF1Q6 2029-01-01 121.20 14.1316 2.25
LFT BRSTNCLF1RL5 2029-03-01 345.08 0.0402 0.00
NTN-B BRSTNCNTB716 2029-05-15 59.19 8.0061 2.73
LTN BRSTNCLTN8K6 2029-07-01 127.84 14.1809 2.86
LFT BRSTNCLF1RM3 2029-09-01 311.80 0.0524 0.00
LTN BRSTNCLTN8A7 2030-01-01 86.71 14.2030 3.30
LFT BRSTNCLF1RO9 2030-03-01 256.95 0.0650 0.00
LFT BRSTNCLF1RQ4 2030-06-01 190.79 0.0680 0.00
NTN-B BRSTNCNTB3B8 2030-08-15 222.18 8.0302 3.73
LFT BRSTNCLF1RR2 2030-09-01 209.24 0.0773 0.00
LFT BRSTNCLF1RT8 2030-12-01 138.80 0.0794 0.00
LTN BRSTNCLTN8D1 2031-01-01 2.84
NTN-F BRSTNCNTF204 2031-01-01 188.01 14.3318 3.48
LFT BRSTNCLF1RU6 2031-03-01 190.80 0.0909 0.00
NTN-B BRSTNCNTB7X3 2031-05-15 7.07 7.9835 4.19
LFT BRSTNCLF1RW2 2031-06-01 181.97 0.0948 0.00
LFT BRSTNCLF1RX0 2031-09-01 154.49 0.0968 0.00
LFT BRSTNCLF1RZ5 2031-12-01 127.72 0.0993 0.00
LTN BRSTNCLTN8J8 2032-01-01 84.89 14.3080 5.05
LFT BRSTNCLF1S08 2032-03-01 74.57 0.1066 0.00
NTN-B BRSTNCNTB674 2032-08-15 111.52 7.9233 5.10
NTN-F BRSTNCNTF212 2033-01-01 70.73 14.3115 4.43
NTN-B BRSTNCNTB6B1 2033-05-15 63.16 7.9040 5.48
NTN-F BRSTNCNTF238 2035-01-01 101.29 14.2827 5.14
NTN-B BRSTNCNTB0O7 2035-05-15 249.83 7.6976 6.61
NTN-F BRSTNCNTF2K7 2037-01-01 20.24 14.2942 5.66
NTN-B BRSTNCNTB7Y1 2037-05-15 7.56 7.5936 7.59
NTN-B BRSTNCNTB3C6 2040-08-15 137.45 7.4454 9.07
NTN-B BRSTNCNTB0A6 2045-05-15 171.26 7.3593 10.37
NTN-B BRSTNCNTB3D4 2050-08-15 231.34 7.3141 11.66
NTN-B BRSTNCNTB4Q4 2055-05-15 157.18 7.3081 12.11
NTN-B BRSTNCNTB690 2060-08-15 96.14 7.3082 12.80